1. Problem Recognition, Definition and Evaluation
With increasing electricity rate, I am planning to install a photovoltaic solar panels system on my house. I want to investigate which PV arrangement will provide me with a good investment.
For that I use the tool mentioned in Engineering Economy Engineering Book, chapter 5, Introducing Concept of Minimum Attractive Rate of Return (MARR) and Internal Rate of Return (IRR), page
178-211,
The electricity price increases is shown at Table 1.
| Year | Increase Per
Year (%) |
|
2010
|
|
|
2011
|
0.05
|
|
2012
|
0.035
|
|
2013
|
0.04
|
Table 1. Increase of electricity from 2010 until 2013
Electricity rate is currently at 25.9052c per kW, with supply fee of 43.2072c per day. Using the current electricity rate and apply it to year 2010, then we can calculate the rate increase
for 2011, 2012 and 2013. The result is shown in Table 2. Plotting data from Table 2 in a graph, then we can plot a trend line with intercept at 0.259025, which then give us the linear
regression formula for the rate increase. As shown in Figure 1, the formula is as follow:
Y = 0.0114 (x) + 0.2591
Y = electricity rate at year x
X = year (in 0, 1, 2, 3)
|
Year
|
Increase Per
Year (%) |
|
0
|
0.259052
|
|
1
|
0.27200
|
|
2
|
0.281525
|
|
3
|
0.292786
|
Table 2. Electricity rate from Y0 until Y3

Figure 1.Electricity rate increase
Using the formula then we can get the electricity rate from Y0 until Y30
The typical electricity consumption in my house is following Table 3.
| Electricity Consumption | ||
| Day (kWh) | Night (kWh) | Total (kWh) |
|
3
|
7
|
10
|
| Annually days | Annually Nights | Total (kWh) |
|
1,095
|
2,555
|
3,650
|
Table 3. Electricity consumption
So, the current electricity cost is as per Table 4. This calculation will be my base (Year 0) in my cash flow calculation.
| Annual fix electricity cost: |
$ 157.71
|
| Daily electricity cost |
$ 2.59
|
| Day time annual elect cost |
$ 283.66
|
| Night time annual elect cost |
$ 661.88
|
| Annual electricity cost |
$ 1,103.25
|
Table 4. Current Electricity cost
In average the sun is shining 6 hours per day or 2,190 hours per year. As the PV system does not include batteries, so it only works during day time, where any excess of the generated energy
will be exported to the grid. The feed in tariff is 20c per kWh.
For this investment I plan to pay it all with my credit card. My credit card interest rate is 13%.
2. Development of feasible alternatives
The alternatives are as follow:
1. Install 1.5kW system
2. Install 2kW system
3. Install 5kW system
For each of the alternatives, the current PV systems characteristic is as per Table 5.
|
System Capacity (kW)
|
1.5kW
|
3kW
|
5kW
|
|
No of panels (ea)
|
6
|
12
|
20
|
|
Panel capacity (kW)
|
0.25
|
0.25
|
0.25
|
|
Total panel capacity (kW)
|
1.5
|
3
|
5
|
|
Panel installation cost
|
$ 3,002
|
$ 5,162
|
$ 8,083
|
|
Daily PV Output (kWh)
|
9
|
18
|
30
|
|
Internal use (kWh)
|
3
|
3
|
3
|
|
Export (kWh)
|
6
|
15
|
27
|
|
Avg Annual PV Output (kWh)
|
3,285
|
6,570
|
10,950
|
|
Internal use (kWh)
|
1,095
|
1,095
|
1,095
|
|
Export (kWh)
|
2,190
|
5,475
|
9,855
|
|
Annual Maintenance Cost
|
|||
|
Checking panels
|
$ 150
|
$ 150
|
$ 150
|
|
Panel cleaning (ea)
|
$ 20
|
$ 20
|
$ 20
|
|
Total maintenance cost
|
$ 270
|
$ 390
|
$ 550
|
Table 5. Current PV systems characteristic
The PV system capacity is degraded by 0.05% each year. The PV life time is 30 years. The inverter needs to be replaced every 10 years. The inverter cost is about 25% of the overall
installation cost.
3. Development of outcomes for each alternative
The cash flow for each of the alternatives is shown in Figure 2, 3, and 4.


Figure 2. Cash flow for Option 1


Figure 3. Cash flow for Option 2
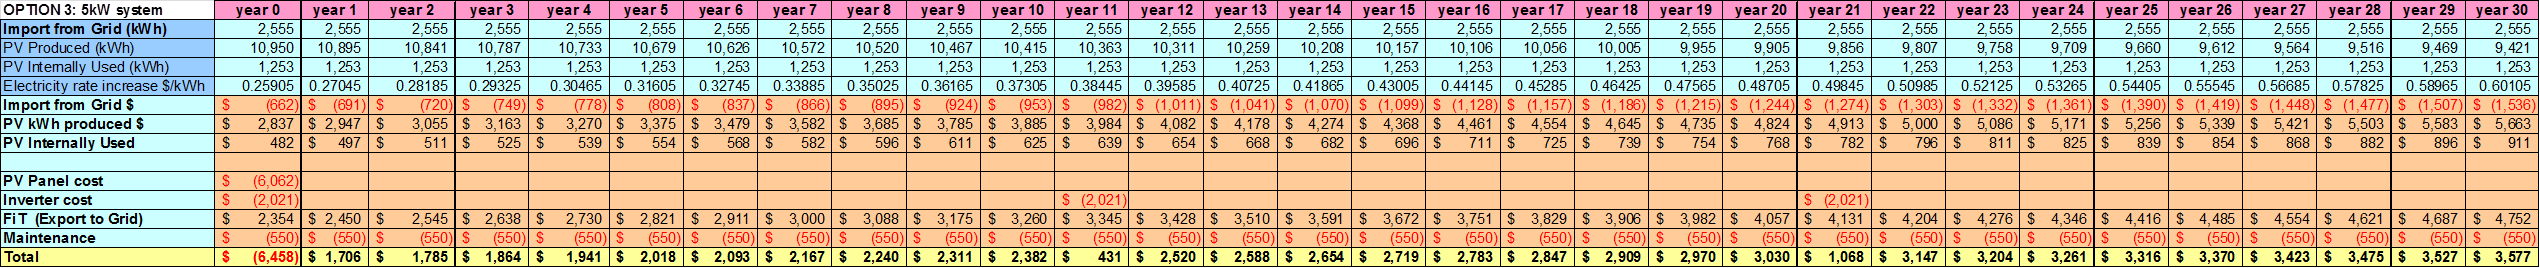
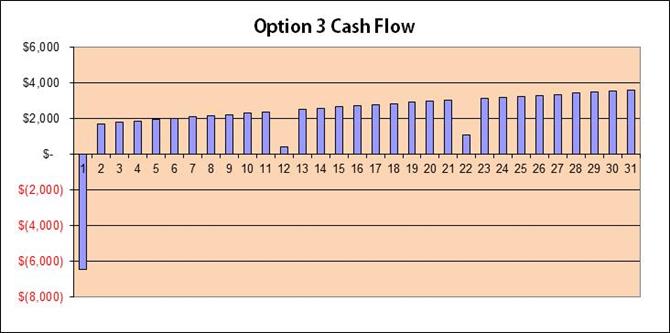 Figure 4. Cash flow for Option 3
4. Selection of Criterion
As I am going to pay my PV system using my credit card, it means that my WACC is equal to my credit card interest rate (WACC=13%).
I need to identify the IRR for each of the alternatives.
The calculation is based on this formula:
PW (i) = F0(1+i)0 + F1(1+i)-1 + F2(1+i)-2 + … + Fn(1+i)-n = 0
Where i = IRR; Fn = future cash flow at the end of period n; n = study period
Using IRR = WACC value as my initial value I can determine the PW for each of the arrangement, and then identify what is the i% which can make PW for each option equal to 0. The i% is the IRR
for this particular option.
The result is shown in Table 6 below.
|
OPTION 1
|
OPTION 2
|
OPTION 3
|
|
| PW(13%) | (3,835.6) |
1,865.13
|
9,421.68
|
| IRR |
–
|
18%
|
30%
|
Table 6. PW(i) result at i = WACC = 13% and IRR for each options
5. Analysis and Comparison of the Alternatives
The simulation result in Table 3 shows that PW(WACC=13%) for Option 1 is negative and does not provide result for IRR calculation. Option 2 and Option 3 show positive results, which mean both
are economically justifiable.
6. Selection of the Preferred Alternative
As Option 2 and Option 3 show positive PW results and each IRR is bigger than the WACC, I need to select between these 2 options. As the investment requirement for Option 2 is cheaper than
Option 3, I chose Option 2. As I selected Option 2, then I am using 22% as my solar PV MARR.
7. Performance Monitoring and the Post Evaluation of Result
The simulation is based on a system where PV is only used during day time. Meanwhile most of the load is actually happen at night. Investigating application of energy storage to the system
will be quite interesting.
References
Government of Western Australia Department of Finance. (n.d). Electricity prices. Retrieved from http://www.finance.wa.gov.au/cms/content.aspx?id=14703
Sullivan, W. G., Wicks, E. M., & Koelling, C. P. (2012). Engineering Economy (15th Ed.) (pp.180-185). New Jersey, United States: Prentice Hall.
Solar Choice. (September 8, 2013).Solar PV Price Index-September 2013. Retrieved from: http://www.solarchoice.net.au/blog/solar-pv-price-index-september-2013/
Blanch, C. (Aug 26, 2013). Hidden cost of rooftop solar: Who should pay for maintenance? In RenewEconomy. Retrieved from:
http://reneweconomy.com.au/2013/hidden-cost-of-rooftop-solar-who-should-pay-for-maintenance-99200
Synergy. (n.d). Prices & fees. http://www.synergy.net.au/at_home/prices.xhtml
MBAbullshitDotCom . (Feb 27, 2010). IRR Internal Rate of Return Explained in 3 Easy Steps: How to Calculate Internal Rate of Return [Video file]. Retrieved from:
MBAbullshitDotCom . (Mar 08, 2010). Weighted Average Cost of Capital (WACC) in 3 Easy Steps: How to Calculate WACC [Video file]. Retrieved from:
Sheftalovich, Z. (Jun 18, 2013). Solar panel payback times. Retrieved from: http://www.choice.com.au/reviews-and-tests/household/energy-and-water/solar/solar-payback-times.aspx
Energymatters. (n.d). Solar power – Perth & Western Australia special deals. Retrieved from: http://www.energymatters.com.au/specials/western-australia-solar-discounts.php

OK Pak Sadat, NOW you’ve got it…….. Nice work this time!!!
Looking forward to seeing another one of this quality for your W5 report…..
BR,
Dr. PDG, Jakarta
LikeLike