1. Problem Definition
In this blog I am going to do find out the Payback Period for my PV installation, based on the data that I had used for my W4 Blog. With this Blog, I also would like to use this blog to claim for Problem Solving Work for Engineering Economic Chapter 5 Evaluating a Single Project.
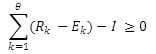
The Payback Period Method calculates the number of year for the cash inflow to just equal to the cast out flow. The Simple Payback Period calculation, which ignores the time value of money, is based on the following formula:
 (1-1)
(1-1)
Rk = excess of revenue over expenditure in period k;
Ek = excess of expenditure over revenue in period k;
Ɵ = payback period
I = capital investment at k=0
For Discounted payback Period calculation, which considers the time value of money, the calculation is based on the following equation:
 (1-2)
(1-2)
Ɵ’ = discounted payback period
i% = MARR
2. Alternative Identification
As per my previous blog, in this case I have 3 alternative of PV system.
The alternatives are as follow:
1. Install 1.5kW system
2. Install 2kW system
3. Install 5kW system
For each of the alternatives, the current PV systems characteristic is as per Table 1.
| System Capacity (kW) | 1.5kW |
3kW |
5kW |
| No of panels (ea) |
6 |
12 |
20 |
| Panel capacity (kW) |
0.25 |
0.25 |
0.25 |
| Total panel capacity (kW) |
1.5 |
3 |
5 |
| Panel installation cost |
$ 3,002 |
$ 5,162 |
$ 8,083 |
| Daily PV Output (kWh) |
9 |
18 |
30 |
| Internal use (kWh) |
3 |
3 |
3 |
| Export (kWh) |
6 |
15 |
27 |
| Avg Annual PV Output (kWh) |
3,285 |
6,570 |
10,950 |
| Internal use (kWh) |
1,095 |
1,095 |
1,095 |
| Export (kWh) |
2,190 |
5,475 |
9,855 |
| Annual Maintenance Cost | |||
| Checking panels | $ 150 | $ 150 | $ 150 |
| Panel cleaning (ea) | $ 20 | $ 20 | $ 20 |
| Total maintenance cost | $ 270 | $ 390 | $ 550 |
Table 1. Current PV systems characteristic
The PV system capacity is degraded by 0.05% each year. The PV life time is 30 years. The inverter needs to be replaced every 10 years. The inverter cost is about 25% of the overall installation cost.
The cash flow for each of the alternatives is shown in Figure 2, 3, and 4.

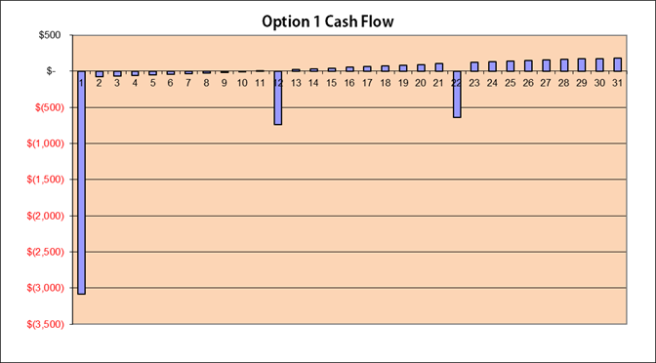
Figure 2. Cash flow for Option 1

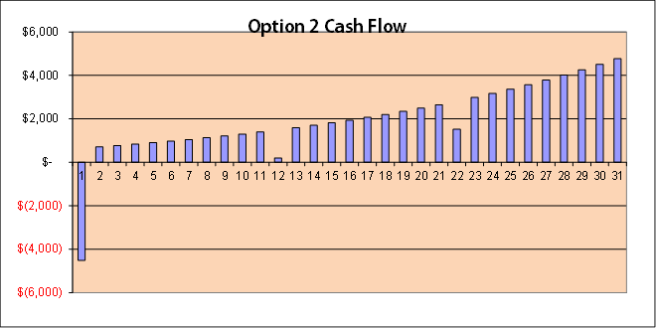
Figure 3. Cash flow for Option 2

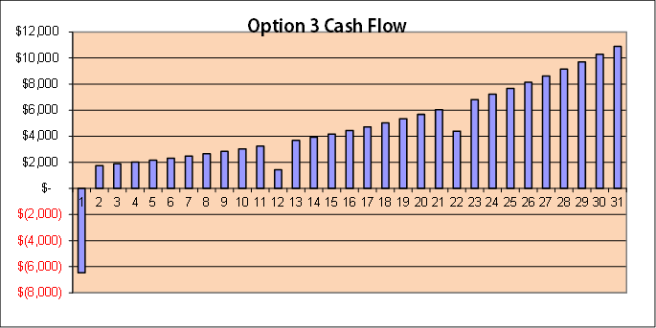
Figure 4. Cash flow for Option 3
3. Outcome for each Alternatives
To calculate Payback Period, the i% is set equal to MARR. As mentioned in blog W4, MARR is set to be equal to IRR. In this project only Option 2 and 3 have positive IRR. The IRR for Option 2 is 22%, while IRR for Option 3 is set at 34%. Using Equation 1-2 and 1-3, for Option 2 and 3, the i’% is calculated, as shown in Figure 5 and 6.
The calculation result for each options using equation 1-2 are as follow:

Figure 5. Payback calculation for Option 2

Figure 6. Payback calculation for Option 3
4. Selection Criteria
A project is acceptable when the payback period is smaller than project’s life time.
5. Analysis and Comparison of the Alternative
Based on the calculation results which are shown in Figure 5 and 6, Option 2 will have payback time by year 24, and Option 3 will have the payback time by year 6. Both projects are acceptable.
This analysis gives me, as an investor, slightly different perspective compare to the previous analysis. For me, 24 years is quite a long time payback period for an investment. In 24 years I may not even live in the same house. Because of that, my preference is now change from Option 2 to Option 3.
6. Performance Monitoring and the Post Evaluation of Result
Option 3 is now my preferred option, as it gives me sooner payback period. That if the parameter of my option still the same as my predictions. If the parameters change, the calculation result will change as well. Once I select the type of PV to be installed, I still need to keep track my actual investment parameter, so then if the parameters change, I can review my investment.
References
Sullivan, William G., Wicks, Elin M., & C.Patrick, Koelling. (2012), Engineering Economy 15th Edition (pp. 205-211). New Jersey, United States: Prentice Hall.
Permana, Arief. (Sept 10, 2013). W6_APE_Low Cost Hotel Accommodation-LCHA, ERR & Payback Period. Retrieved from: http://simatupangaace2014.wordpress.com/2013/09/10/w6_ape_low-cost-hotel-accommodation-lcha-err-payback-period/
Government of Western Australia Department of Finance. (n.d). Electricity prices. Retrieved from http://www.finance.wa.gov.au/cms/content.aspx?id=14703
Solar Choice. (September 8, 2013).Solar PV Price Index–September 2013. Retrieved from: http://www.solarchoice.net.au/blog/solar-pv-price-index-september-2013/
Blanch, C. (Aug 26, 2013). Hidden cost of rooftop solar: Who should pay for maintenance? In RenewEconomy. Retrieved from: http://reneweconomy.com.au/2013/hidden-cost-of-rooftop-solar-who-should-pay-for-maintenance-99200
Synergy. (n.d). Prices & fees. http://www.synergy.net.au/at_home/prices.xhtml
Sheftalovich, Z. (Jun 18, 2013). Solar panel payback times. Retrieved from: http://www.choice.com.au/reviews-and-tests/household/energy-and-water/solar/solar-payback-times.aspx
Energymatters. (n.d). Solar power – Perth & Western Australia special deals. Retrieved from: http://www.energymatters.com.au/specials/western-australia-solar-discounts.php

EXCELLENT job this time around, Pak Sadat!!!
Make sure you remember this the next time you are writing a technical paper (or answering an essay type question) that it is important to include all your assumptions and an explanation for any numbers you use.
BR,
Dr, PDG, Jakarta
LikeLike